Note
Click here to download the full example code
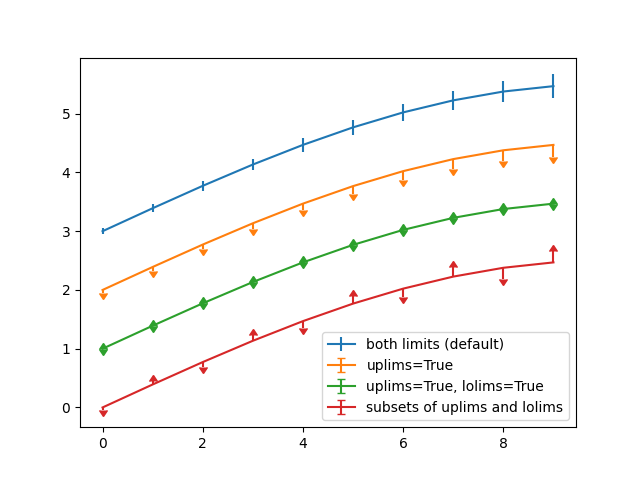
Errorbar limit selection
Illustration of selectively drawing lower and/or upper limit symbols on
errorbars using the parameters uplims, lolims of errorbar.
Alternatively, you can use 2xN values to draw errorbars in only one direction.
import numpy as np
import matplotlib.pyplot as plt


fig = plt.figure()
x = np.arange(10)
y = 2.5 * np.sin(x / 20 * np.pi)
yerr = np.linspace(0.05, 0.2, 10)

plt.errorbar(x, y + 3, yerr=yerr, label='both limits (default)')

plt.errorbar(x, y + 2, yerr=yerr, uplims=True, label='uplims=True')

plt.errorbar(x, y + 1, yerr=yerr, uplims=True, lolims=True,
             label='uplims=True, lolims=True')

upperlimits = [True, False] * 5
lowerlimits = [False, True] * 5
plt.errorbar(x, y, yerr=yerr, uplims=upperlimits, lolims=lowerlimits,
             label='subsets of uplims and lolims')

plt.legend(loc='lower right')
Out:
<matplotlib.legend.Legend object at 0x7f79ea4264c0>
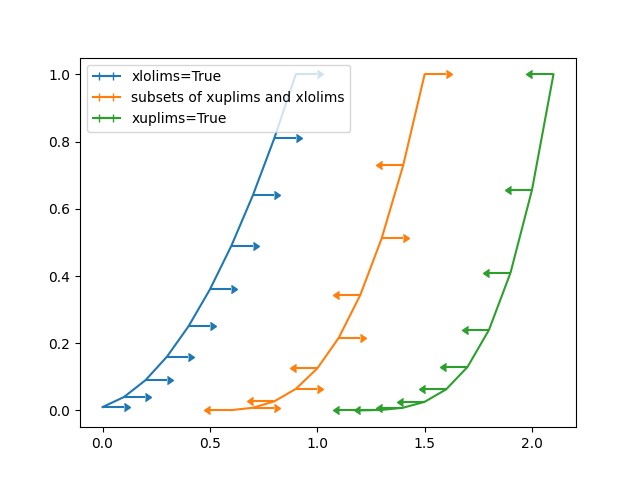
Similarly xuplims and xlolims can be used on the horizontal xerr
errorbars.
fig = plt.figure()
x = np.arange(10) / 10
y = (x + 0.1)**2

plt.errorbar(x, y, xerr=0.1, xlolims=True, label='xlolims=True')
y = (x + 0.1)**3

plt.errorbar(x + 0.6, y, xerr=0.1, xuplims=upperlimits, xlolims=lowerlimits,
             label='subsets of xuplims and xlolims')

y = (x + 0.1)**4
plt.errorbar(x + 1.2, y, xerr=0.1, xuplims=True, label='xuplims=True')

plt.legend()
plt.show()
References
The use of the following functions, methods, classes and modules is shown in this example:
import matplotlib
matplotlib.axes.Axes.errorbar
matplotlib.pyplot.errorbar
Out:
<function errorbar at 0x7f79f26d1d30>
Total running time of the script: ( 0 minutes 1.003 seconds)
Keywords: matplotlib code example, codex, python plot, pyplot Gallery generated by Sphinx-Gallery