Note
Click here to download the full example code
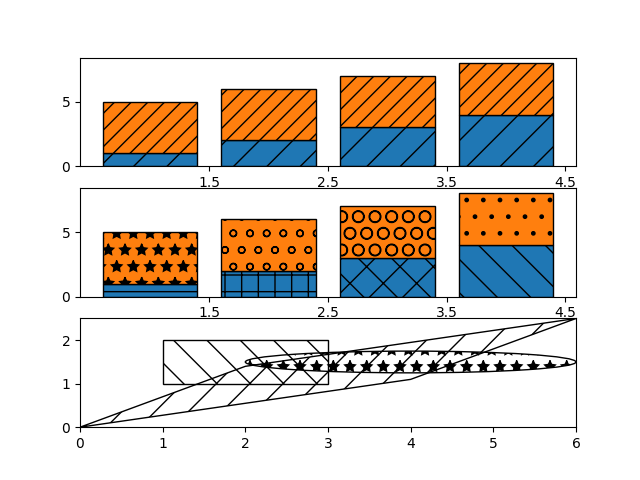
Hatch Demo
Hatching (pattern filled polygons) is supported currently in the PS, PDF, SVG and Agg backends only.
import numpy as np
import matplotlib.pyplot as plt
from matplotlib.patches import Ellipse, Polygon

x = np.arange(1, 5)
y1 = np.arange(1, 5)
y2 = np.ones(y1.shape) * 4

fig, (ax1, ax2, ax3) = plt.subplots(3)

ax1.bar(x, y1, edgecolor='black', hatch="/")
ax1.bar(x, y2, bottom=y1, edgecolor='black', hatch='//')
ax1.set_xticks([1.5, 2.5, 3.5, 4.5])

ax2.bar(x, y1, edgecolor='black', hatch=['-', '+', 'x', '\\'])
ax2.bar(x, y2, bottom=y1, edgecolor='black', hatch=['*', 'o', 'O', '.'])
ax2.set_xticks([1.5, 2.5, 3.5, 4.5])

ax3.fill([1, 3, 3, 1], [1, 1, 2, 2], fill=False, hatch='\\')
ax3.add_patch(Ellipse((4, 1.5), 4, 0.5, fill=False, hatch='*'))
ax3.add_patch(Polygon([[0, 0], [4, 1.1], [6, 2.5], [2, 1.4]], closed=True,
                      fill=False, hatch='/'))
ax3.set_xlim((0, 6))
ax3.set_ylim((0, 2.5))

plt.show()
References
The use of the following functions, methods, classes and modules is shown in this example:
Out:
<function bar at 0x7f79f26d1700>
Keywords: matplotlib code example, codex, python plot, pyplot Gallery generated by Sphinx-Gallery