API Changes for 3.2.0
Behavior changes
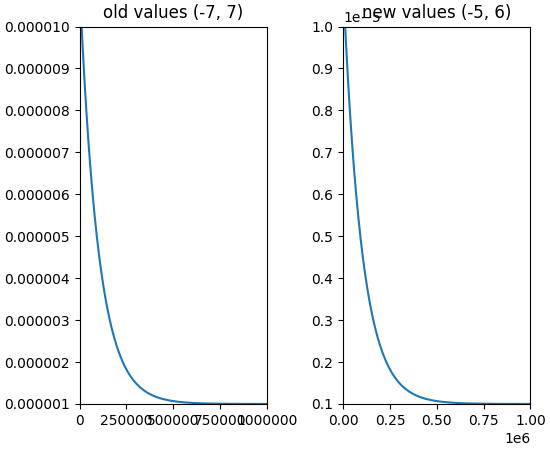
Reduced default value of rcParams["axes.formatter.limits"] (default: [-5, 6])
Changed the default value of rcParams["axes.formatter.limits"] (default: [-5, 6]) from -7, 7 to
-5, 6 for better readability.
(Source code, png, pdf)

matplotlib.colorbar.Colorbar uses un-normalized axes for all mappables
Before 3.0, matplotlib.colorbar.Colorbar (colorbar) normalized
all axes limits between 0 and 1 and had custom tickers to handle the
labelling of the colorbar ticks. After 3.0, colorbars constructed from
mappables that were not contours were constructed with axes that had
limits between vmin and vmax of the mappable's norm, and the tickers
were made children of the normal axes tickers.
This version of Matplotlib extends that to mappables made by contours, and allows the axes to run between the lowest boundary in the contour and the highest.
Code that worked around the normalization between 0 and 1 will need to be modified.
MovieWriterRegistry
MovieWriterRegistry now always checks the availability of the writer classes
before returning them. If one wishes, for example, to get the first available
writer, without performing the availability check on subsequent writers, it is
now possible to iterate over the registry, which will yield the names of the
available classes.
Autoscaling
Matplotlib used to recompute autoscaled limits after every plotting
(plot(), bar(), etc.) call. It now only does so when actually
rendering the canvas, or when the user queries the Axes limits. This is a
major performance improvement for plots with a large number of artists.
In particular, this means that artists added manually with Axes.add_line,
Axes.add_patch, etc. will be taken into account by the autoscale, even
without an explicit call to Axes.autoscale_view.
In some cases, this can result in different limits being reported. If this is
an issue, consider triggering a draw with fig.canvas.draw().
Autoscaling has also changed for artists that are based on the Collection
class. Previously, the method that calculates the automatic limits
Collection.get_datalim tried to take into account the size of objects
in the collection and make the limits large enough to not clip any of the
object, i.e., for Axes.scatter it would make the limits large enough to not
clip any markers in the scatter. This is problematic when the object size is
specified in physical space, or figure-relative space, because the transform
from physical units to data limits requires knowing the data limits, and
becomes invalid when the new limits are applied. This is an inverse
problem that is theoretically solvable (if the object is physically smaller
than the axes), but the extra complexity was not deemed worth it, particularly
as the most common use case is for markers in scatter that are usually small
enough to be accommodated by the default data limit margins.
While the new behavior is algorithmically simpler, it is conditional on
properties of the Collection object:
offsets = None,transformis a child ofAxes.transData: use the paths for the automatic limits (i.e. forLineCollectioninAxes.streamplot).offsets != None, andoffset_transformis child ofAxes.transData:
transformis child ofAxes.transData: use thepath + offsetfor- limits (i.e., for
Axes.bar).
transformis not a child ofAxes.transData: just use the offsets- for the limits (i.e. for scatter)
- otherwise return a null
Bbox.
While this seems complicated, the logic is simply to use the information from the object that are in data space for the limits, but not information that is in physical units.
log-scale bar() / hist() autolimits
The autolimits computation in bar and hist when the axes
already uses log-scale has changed to match the computation when the axes is
switched to log-scale after the call to bar and hist, and
when calling bar(..., log=True) / hist(..., log=True): if there are
at least two different bar heights, add the normal axes margins to them (in
log-scale); if there is only a single bar height, expand the axes limits by one
order of magnitude around it and then apply axes margins.
Axes labels spanning multiple rows/columns
Axes.label_outer now correctly keep the x labels and tick labels visible
for Axes spanning multiple rows, as long as they cover the last row of the Axes
grid. (This is consistent with keeping the y labels and tick labels visible
for Axes spanning multiple columns as long as they cover the first column of
the Axes grid.)
The Axes.is_last_row and Axes.is_last_col methods now correctly return
True for Axes spanning multiple rows, as long as they cover the last row or
column respectively. Again this is consistent with the behavior for axes
covering the first row or column.
The Axes.rowNum and Axes.colNum attributes are deprecated, as they only
refer to the first grid cell covered by the Axes. Instead, use the new
ax.get_subplotspec().rowspan and ax.get_subplotspec().colspan
properties, which are range objects indicating the whole span of rows and
columns covered by the subplot.
(Note that all methods and attributes mentioned here actually only exist on
the Subplot subclass of Axes, which is used for grid-positioned Axes but
not for Axes positioned directly in absolute coordinates.)
The GridSpec class gained the nrows and ncols properties as more
explicit synonyms for the parameters returned by GridSpec.get_geometry.
Locators
When more than Locator.MAXTICKS ticks are generated, the behavior of
Locator.raise_if_exceeds changed from raising a RuntimeError to emitting a
log at WARNING level.
nonsingular Locators
Locator.nonsingular (introduced in mpl 3.1), DateLocator.nonsingular, and
AutoDateLocator.nonsingular now returns a range v0, v1 with v0 <= v1.
This behavior is consistent with the implementation of nonsingular by the
LogLocator and LogitLocator subclasses.
get_data_ratio
Axes.get_data_ratio now takes the axes scale into account (linear, log,
logit, etc.) before computing the y-to-x ratio. This change allows fixed
aspects to be applied to any combination of x and y scales.
Artist sticky edges
Previously, the sticky_edges attribute of artists was a list of values such
that if an axis limit coincides with a sticky edge, it would not be expanded by
the axes margins (this is the mechanism that e.g. prevents margins from being
added around images).
sticky_edges now have an additional effect on margins application: even if
an axis limit did not coincide with a sticky edge, it cannot cross a sticky
edge through margin application -- instead, the margins will only expand the
axis limit until it bumps against the sticky edge.
This change improves the margins of axes displaying a streamplot:
- if the streamplot goes all the way to the edges of the vector field, then the axis limits are set to match exactly the vector field limits (whereas they would sometimes be off by a small floating point error previously).
- if the streamplot does not reach the edges of the vector field (e.g., due to
the use of
start_pointsandmaxlength), then margins expansion will not cross the vector field limits anymore.
This change is also used internally to ensure that polar plots don't display negative r values unless the user really passes in a negative value.
gid in svg output
Previously, if a figure, axis, legend or some other artists had a custom
gid set (e.g. via .set_gid()), this would not be reflected in
the svg output. Instead a default gid, like figure_1 would be shown.
This is now fixed, such that e.g. fig.set_gid("myfigure") correctly
shows up as <g id="myfigure"> in the svg file. If you relied on the
gid having the default format, you now need to make sure not to set the
gid parameter of the artists.
Fonts
Font weight guessing now first checks for the presence of the FT_STYLE_BOLD_FLAG before trying to match substrings in the font name. In particular, this means that Times New Roman Bold is now correctly detected as bold, not normal weight.
Color-like checking
matplotlib.colors.is_color_like used to return True for all string
representations of floats. However, only those with values in 0-1 are valid
colors (representing grayscale values). is_color_like now returns False
for string representations of floats outside 0-1.
Default image interpolation
Images displayed in Matplotlib previously used nearest-neighbor interpolation, leading to aliasing effects for downscaling and non-integer upscaling.
New default for rcParams["image.interpolation"] (default: 'antialiased') is the new option "antialiased".
imshow(A, interpolation='antialiased') will apply a Hanning filter when
resampling the data in A for display (or saving to file) if the upsample
rate is less than a factor of three, and not an integer; downsampled data is
always smoothed at resampling.
To get the old behavior, set rcParams["image.interpolation"] (default: 'antialiased') to the old default "nearest"
(or specify the interpolation kwarg of Axes.imshow)
To always get the anti-aliasing behavior, no matter what the up/down sample
rate, set rcParams["image.interpolation"] (default: 'antialiased') to "hanning" (or one of the other filters
available).
Note that the "hanning" filter was chosen because it has only a modest performance penalty. Anti-aliasing can be improved with other filters.
rcParams
When using RendererSVG with rcParams["svg.image_inline"] ==
True, externally written images now use a single counter even if the
renderer.basename attribute is overwritten, rather than a counter per
basename.
This change will only affect you if you used rcParams["svg.image_inline"] = True
(the default is False) and manually modified renderer.basename.
Changed the default value of rcParams["axes.formatter.limits"] (default: [-5, 6]) from -7, 7 to -5, 6
for better readability.
add_subplot()
Figure.add_subplot() and pyplot.subplot() do not accept a figure
keyword argument anymore. It only used to work anyway if the passed figure
was self or the current figure, respectively.
indicate_inset()
In <= 3.1.0, indicate_inset and
indicate_inset_zoom were documented as returning
a 4-tuple of ConnectionPatch, where in fact they
returned a 4-length list.
They now correctly return a 4-tuple.
indicate_inset would previously raise an error if
the optional inset_ax was not supplied; it now completes successfully,
and returns None instead of the tuple of ConnectionPatch.
PGF backend
The pgf backend's get_canvas_width_height now returns the canvas size in
display units rather than in inches, which it previously did.
The new behavior is the correct one given the uses of get_canvas_width_height
in the rest of the codebase.
The pgf backend now includes images using \includegraphics instead of
\pgfimage if the version of graphicx is recent enough to support the
interpolate option (this is detected automatically).
cbook
The default value of the "obj_type" parameter to cbook.warn_deprecated has
been changed from "attribute" (a default that was never used internally) to the
empty string.
Testing
The test suite no longer turns on the Python fault handler by default.
Set the standard PYTHONFAULTHANDLER environment variable to do so.
Backend supports_blit
Backends do not need to explicitly define the flag supports_blit anymore.
This is only relevant for backend developers. Backends had to define the flag
supports_blit. This is not needed anymore because the blitting capability
is now automatically detected.
Exception changes
Various APIs that raised a ValueError for incorrectly typed inputs now raise
TypeError instead: backend_bases.GraphicsContextBase.set_clip_path,
blocking_input.BlockingInput.__call__, cm.register_cmap, dviread.DviFont,
rcsetup.validate_hatch, rcsetup.validate_animation_writer_path, spines.Spine,
many classes in the matplotlib.transforms module and matplotlib.tri
package, and Axes methods that take a norm parameter.
If extra kwargs are passed to LogScale, TypeError will now be
raised instead of ValueError.
mplot3d auto-registration
mpl_toolkits.mplot3d is always registered by default now. It is no
longer necessary to import mplot3d to create 3d axes with
ax = fig.add_subplot(111, projection="3d")
SymLogNorm now has a base parameter
Previously, SymLogNorm had no base keyword argument and the base was
hard-coded to base=np.e. This was inconsistent with the default behavior of
SymmetricalLogScale (which defaults to base=10) and the use of the word
"decade" in the documentation.
In preparation for changing the default base to 10, calling SymLogNorm
without the new base keyword argument emits a deprecation warning.
Deprecations
matplotlib.use
The warn parameter to matplotlib.use() is deprecated (catch the
ImportError emitted on backend switch failure and reemit a warning yourself
if so desired).
plotfile
.pyplot.plotfile is deprecated in favor of separately loading and plotting
the data. Use pandas or NumPy to load data, and pandas or matplotlib to plot
the resulting data.
axes and axis
Setting Axis.major.locator, Axis.minor.locator, Axis.major.formatter
or Axis.minor.formatter to an object that is not a subclass of Locator or
Formatter (respectively) is deprecated. Note that these attributes should
usually be set using Axis.set_major_locator, Axis.set_minor_locator, etc.
which already raise an exception when an object of the wrong class is passed.
Passing more than one positional argument or unsupported keyword arguments to
axis() is deprecated (such arguments used to be
silently ignored).
minor argument will become keyword-only
Using the parameter minor to get_*ticks() / set_*ticks() as a
positional parameter is deprecated. It will become keyword-only in future
versions.
axes_grid1
The mpl_toolkits.axes_grid1.colorbar module and its colorbar implementation
are deprecated in favor of matplotlib.colorbar, as the former is
essentially abandoned and the latter is a more featureful replacement with a
nearly compatible API (for example, the following additional keywords are
supported: panchor, extendfrac, extendrect).
The main differences are:
- Setting the ticks on the colorbar is done by calling
colorbar.set_ticksrather thancolorbar.cbar_axis.set_xticksorcolorbar.cbar_axis.set_yticks; thelocatorparameter tocolorbar()is deprecated in favor of its synonymticks(which already existed previously, and is consistent withmatplotlib.colorbar). - The colorbar's long axis is accessed with
colorbar.xaxisorcolorbar.yaxisdepending on the orientation, rather thancolorbar.cbar_axis. - The default ticker is no longer
MaxNLocator(5), but a_ColorbarAutoLocator. - Overdrawing multiple colorbars on top of one another in a single Axes (e.g.
when using the
caxattribute ofImageGridelements) is not supported; if you previously relied on the second colorbar being drawn over the first, you can callcax.cla()to clear the axes before drawing the second colorbar.
During the deprecation period, the mpl_toolkits.legacy_colorbar
rcParam can be set to True to use mpl_toolkits.axes_grid1.colorbar in
mpl_toolkits.axes_grid1 code with a deprecation warning (the default),
or to False to use matplotlib.colorbar.
Passing a pad size of None (the default) as a synonym for zero to
the append_axes, new_horizontal and new_vertical methods of
axes_grid1.axes_divider.AxesDivider is deprecated. In a future release, the
default value of None will mean "use rcParams["figure.subplot.wspace"] (default: 0.2) or
rcParams["figure.subplot.hspace"] (default: 0.2)" (depending on the orientation). Explicitly pass
pad=0 to keep the old behavior.
Axes3D
mplot3d.axis3d.get_flip_min_max is deprecated.
axes3d.unit_bbox is deprecated (use Bbox.unit instead).
axes3d.Axes3D.w_xaxis, .w_yaxis, and .w_zaxis are deprecated (use
.xaxis, .yaxis, and .zaxis instead).
matplotlib.cm
cm.revcmap is deprecated. Use Colormap.reversed to reverse a colormap.
cm.datad no longer contains entries for reversed colormaps in their
"unconverted" form.
axisartist
mpl_toolkits.axisartist.grid_finder.GridFinderBase is deprecated (its
only use is to be inherited by the GridFinder class which just provides
more defaults in the constructor and directly sets the transforms, so
GridFinderBase's methods were just moved to GridFinder).
axisartist.axis_artist.BezierPath is deprecated (use patches.PathPatch
to draw arbitrary Paths).
AxisArtist.line is now a patches.PathPatch instance instead of a
BezierPath instance.
Returning a factor equal to None from axisartist Locators (which are not the same as "standard" tick Locators), or passing a factor equal to None to axisartist Formatters (which are not the same as "standard" tick Formatters) is deprecated. Pass a factor equal to 1 instead.
For the mpl_toolkits.axisartist.axis_artist.AttributeCopier class, the
constructor and the set_ref_artist method, and the default_value
parameter of get_attribute_from_ref_artist, are deprecated.
Deprecation of the constructor means that classes inheriting from
AttributeCopier should no longer call its constructor.
Locators
The unused Locator.autoscale method is deprecated (pass the axis limits to
Locator.view_limits instead).
Animation
The following methods and attributes of the MovieWriterRegistry class are
deprecated: set_dirty, ensure_not_dirty, reset_available_writers,
avail.
smart_bounds()
The "smart_bounds" functionality is deprecated. This includes
Axis.set_smart_bounds(), Axis.get_smart_bounds(),
Spine.set_smart_bounds(), and Spine.get_smart_bounds().
boxplot()
Setting the whis parameter of Axes.boxplot and cbook.boxplot_stats to
"range" to mean "the whole data range" is deprecated; set it to (0, 100) (which
gets interpreted as percentiles) to achieve the same effect.
fill_between()
Passing scalars to parameter where in fill_between() and
fill_betweenx() is deprecated. While the documentation already states that
where must be of the same size as x (or y), scalars were accepted and
broadcasted to the size of x. Non-matching sizes will raise a ValueError
in the future.
tight_layout()
The renderer parameter to Figure.tight_layout is deprecated; this method
now always uses the renderer instance cached on the Figure.
rcParams
The rcsetup.validate_animation_writer_path function is deprecated.
Setting rcParams["savefig.format"] (default: 'png') to "auto" is deprecated; use its synonym "png" instead.
Setting rcParams["text.hinting"] (default: 'force_autohint') to True or False is deprecated; use their synonyms
"auto" or "none" instead.
rcsetup.update_savefig_format is deprecated.
rcsetup.validate_path_exists is deprecated (use os.path.exists to check
whether a path exists).
rcsetup.ValidateInterval is deprecated.
Dates
dates.mx2num is deprecated.
TK
NavigationToolbar2Tk.set_active is deprecated, as it has no (observable)
effect.
WX
FigureFrameWx.statusbar and NavigationToolbar2Wx.statbar are deprecated.
The status bar can be retrieved by calling standard wx methods
(frame.GetStatusBar() and toolbar.GetTopLevelParent().GetStatusBar()).
backend_wx.ConfigureSubplotsWx.configure_subplots and
backend_wx.ConfigureSubplotsWx.get_canvas are deprecated.
PGF
backend_pgf.repl_escapetext and backend_pgf.repl_mathdefault are
deprecated.
RendererPgf.latexManager is deprecated.
FigureCanvas
FigureCanvasBase.draw_cursor (which has never done anything and has never
been overridden in any backend) is deprecated.
FigureCanvasMac.invalidate is deprecated in favor of its synonym,
FigureCanvasMac.draw_idle.
The dryrun parameter to the various FigureCanvasFoo.print_foo methods
is deprecated.
QuiverKey doc
quiver.QuiverKey.quiverkey_doc is deprecated; use
quiver.QuiverKey.__init__.__doc__ instead.
matplotlib.mlab
mlab.apply_window and mlab.stride_repeat are deprecated.
Fonts
font_manager.JSONEncoder is deprecated. Use font_manager.json_dump to
dump a FontManager instance.
font_manager.createFontList is deprecated. font_manager.FontManager.addfont
is now available to register a font at a given path.
The as_str, as_rgba_str, as_array, get_width and get_height
methods of matplotlib.ft2font.FT2Image are deprecated. Convert the FT2Image
to a NumPy array with np.asarray before processing it.
Colors
The function matplotlib.colors.makeMappingArray is not considered part of
the public API any longer. Thus, it's deprecated.
Using a string of single-character colors as a color sequence (e.g. "rgb") is deprecated. Use an explicit list instead.
Scales
Passing unsupported keyword arguments to ScaleBase, and its subclasses
LinearScale and SymmetricalLogScale, is deprecated and will raise a
TypeError in 3.3.
If extra keyword arguments are passed to LogScale, TypeError will now be
raised instead of ValueError.
Testing
The matplotlib.testing.disable_internet module is deprecated. Use (for
example) pytest-remotedata instead.
Support in matplotlib.testing for nose-based tests is deprecated (a
deprecation is emitted if using e.g. the decorators from that module while
both 1) matplotlib's conftests have not been called and 2) nose is in
sys.modules).
testing.is_called_from_pytest is deprecated.
During the deprecation period, to force the generation of nose base tests, import nose first.
The switch_backend_warn parameter to matplotlib.test has no effect and
is deprecated.
testing.jpl_units.UnitDbl.UnitDbl.checkUnits is deprecated.
DivergingNorm renamed to TwoSlopeNorm
DivergingNorm was a misleading name; although the norm was
developed with the idea that it would likely be used with diverging
colormaps, the word 'diverging' does not describe or evoke the norm's
mapping function. Since that function is monotonic, continuous, and
piece-wise linear with two segments, the norm has been renamed to
TwoSlopeNorm
Misc
matplotlib.get_home is deprecated (use e.g. os.path.expanduser("~"))
instead.
matplotlib.compare_versions is deprecated (use comparison of
distutils.version.LooseVersions instead).
matplotlib.checkdep_ps_distiller is deprecated.
matplotlib.figure.AxesStack is considered private API and will be removed
from the public API in future versions.
BboxBase.is_unit is deprecated (check the Bbox extents if needed).
Affine2DBase.matrix_from_values(...) is deprecated. Use (for example)
Affine2D.from_values(...).get_matrix() instead.
style.core.is_style_file and style.core.iter_style_files
are deprecated.
The datapath rcParam
Use get_data_path instead. (The rcParam is deprecated because it cannot be
meaningfully set by an end user.) The rcParam had no effect from 3.2.0, but
was deprecated only in 3.2.1. In 3.2.1+ if 'datapath' is set in a
matplotlibrc file it will be respected, but this behavior will be removed in 3.3.
Removals
The matplotlib.testing.determinism module, which exposes no public API, has
been deleted.
The following API elements have been removed:
backend_gtk3.PIXELS_PER_INCHbackend_pgf.re_escapetext,backend_pgf.re_mathdefault.- the
matplotlib.backends.tkagg,matplotlib.backends.windowing,matplotlib.backends.wx_compat, andmatplotlib.compat.subprocessmodules RcParams.msg_depr,RcParams.msg_depr_ignore,RcParams.msg_depr_set,RcParams.msg_obsolete,RcParams.msg_backend_obsoleteafm.parse_afm(useafm.AFM instead)axes.Axes.mouseover_setbackend_cairo.ArrayWrapper,backend_cairo.RendererCairo.convert_pathbackend_gtk3.FileChooserDialog.sorted_filetypes(usesorted(self.filetypes.items())instead)backend_pgf.get_texcommandbackend_pdf.PdfFile.texFontMapbackend_ps.get_bboxbackend_qt.FigureCanvasQt.keyAutoRepeat(useevent.guiEvent.isAutoRepeatinstead),backend_qt.error_msg_qt,backend_qt.exception_handlerbackend_wx.FigureCanvasWx.macrosbackends.pylab_setupcbook.Bunch(usetypes.SimpleNamespaceinstead),cbook.Locked,cbook.unicode_safe,cbook.is_numlike(useisinstance(..., numbers.Number)instead),cbook.mkdirs(useos.makedirs(..., exist_ok=True)instead),cbook.GetRealpathAndStat(usecbook.get_realpath_and_statinstead),cbook.listFilescontainer.Container.set_remove_methodcontour.ContourLabeler.cl,contour.ContourLabeler.cl_xy,contour.ContourLabeler.cl_cvalues(uselabelTexts,labelXYs,labelCValuesinstead)dates.DateFormatter.strftime,dates.DateFormatter.strftime_pre_1900font_manager.TempCache,font_manager.FontManager.ttffiles,font_manager.FontManager.afmfilesmathtext.unichr_safe(usechrinstead)patches.YAArrow(usepatches.FancyArrowPatchinstead)sphinxext.plot_directive.remove_codingtable.Table.get_child_artiststesting.compare.compare_float,testing.decorators.CleanupTest,testing.decorators.ImageComparisonTest,testing.decorators.skip_if_command_unavailable, support for nose-based teststext.Annotation.arrow(usetext.Annotation.arrow_patchinstead)textpath.TextToPath.tex_font_mapticker.Base,ticker.closeto,ticker.nearest_longaxes_grid1.axes_divider.LocatableAxesBase,axes_grid1.axes_divider.locatable_axes_factory,axes_grid1.axes_divider.Axes(useaxes_grid1.mpl_axes.Axesinstead),axes_grid1.axes_divider.LocatableAxes(useaxes_grid1.mpl_axes.Axesinstead)axisartist.axes_divider.Axes,axisartist.axes_divider.LocatableAxes(useaxisartist.axislines.Axesinstead)- the
normedkwarg tohist(usedensityinstead) - the
vertsparameter toscatter(usemarkerinstead) - passing
(verts, 0)or(..., 3)when specifying a marker to specify a path or a circle, respectively (instead, usevertsor"o", respectively) rcParams["examples.directory"]
The following members of matplotlib.backends.backend_pdf.PdfFile were removed:
nextObjectnextFontnextAlphaStatenextHatchnextImagealphaStateObject
The required_interactive_framework attribute of backend modules introduced
in Matplotlib 3.0 has been moved to the FigureCanvas class, in order to
let it be inherited by third-party canvas subclasses and to make it easier to
know what interactive framework is required by a canvas class.
backend_qt4.FigureCanvasQT5, which is an alias for
backend_qt5.FigureCanvasQT (but only exists under that name in
backend_qt4), has been removed.
Development changes
Windows build
Previously, when building the matplotlib._png extension, the build
script would add "png" and "z" to the extensions .libraries attribute (if
pkg-config information is not available, which is in particular the case on
Windows).
In particular, this implies that the Windows build would look up files named
png.lib and z.lib; but neither libpng upstream nor zlib upstream
provides these files by default. (On Linux, this would look up libpng.so
and libz.so, which are indeed standard names.)
Instead, on Windows, we now look up libpng16.lib and zlib.lib, which
are the upstream names for the shared libraries (as of libpng 1.6.x).
For a statically-linked build, the upstream names are libpng16_static.lib
and zlibstatic.lib; one still needs to manually rename them if such a build
is desired.
Packaging DLLs
Previously, it was possible to package Windows DLLs into the Maptlotlib
wheel (or sdist) by copying them into the source tree and setting the
package_data.dlls entry in setup.cfg.
DLLs copied in the source tree are now always packaged; the
package_data.dlls entry has no effect anymore. If you do not want to
include the DLLs, don't copy them into the source tree.